Code testing, debugging, and optimization
This video covers the fundamentals of using GDB, Valgrind, and perf for debugging and optimizing C++ code, showcasing techniques to improve performance and eliminate errors.
Lets Go!
Code testing, debugging, and optimization
Lesson 56
Learn best practices for testing and debugging your C++ code, and explore techniques for optimizing performance and memory usage.
Get Started 🍁Introduction to C++ Debugging and Optimization
Welcome to "Introduction to C++ Debugging and Optimization"! In this course, you will delve into the fundamentals of using GDB, Valgrind, Perf, and other tools to debug and optimize C++ code. Whether you're a beginner or looking to enhance your current skills, this course will provide you with a solid foundation to improve your programming efficiency.
Have you ever wondered how to identify and fix segmentation faults in your C++ programs? Or how to optimize your code for maximum performance? This course will answer these questions and more by exploring C++ specific debugging techniques, compiler optimizations, memory management strategies, and algorithmic improvements.
Throughout the course, you'll be guided through practical examples, such as simulating the heat equation, to showcase real-world debugging and optimization methods. By the end of this course, you'll not only have a deeper understanding of C++ debugging and optimization but also gain the necessary skills to tackle complex programming challenges efficiently and effectively.
So, are you ready to unlock the secrets of C++ debugging and optimization? Let's dive in and explore the endless possibilities of improving your programming skills!
Main Concepts of C++ Debugging and Optimization
-
Fundamentals of GDB, Valgrind, and Perf
- GDB, Valgrind, and Perf are essential tools for debugging and optimizing C++ code.
- Each tool serves a specific purpose in identifying and resolving issues within the code.
-
Segmentation Fault
- A segmentation fault occurs when a program tries to access memory it doesn't own.
- Tools like GDB and Valgrind can help pinpoint the source of segmentation faults in the code.
-
Compiler Optimizations
- Compiler optimizations can significantly speed up the program without manual intervention.
- Allowing the compiler to optimize the code can lead to improved performance.
-
Identifying Performance Bottlenecks
- Perf can be used to identify areas where the program is spending most of its time.
- Performance bottlenecks can be caused by factors like unnecessary copies and inefficient memory access patterns.
-
Memory Optimization
- Structuring loops and data access patterns to minimize cache misses can improve performance.
- Pre-allocating memory and optimizing data structures can reduce memory overhead.
-
Algorithmic Optimizations
- Optimizing algorithms such as loop structures can lead to significant performance gains.
- Streamlining computations and discarding redundant operations can improve overall efficiency.
-
Assembly-Level Optimization
- Hand-tuning assembly code or checking generated assembly can further optimize performance.
- Utilizing vector instructions and modern hardware capabilities can enhance program speed.
-
Measurement and Iterative Optimization
- Continuous measurement and iteration are crucial for accurately identifying and resolving performance issues.
- Optimization is an iterative process, with initial changes often yielding larger improvements than later adjustments.
Practical Applications of Debugging and Optimizing C++ Code
In this section, we will provide you with a step-by-step guide to practically apply the debugging and optimization techniques discussed in the video. Follow along and try out these steps on your own code to improve efficiency and performance.
- Debugging with GDB:
- Launch the program with GDB by using the command
gdb <executable_name>. - Run the program in GDB until a segmentation fault occurs.
- Obtain a backtrace using the
btcommand to identify the problematic lines in your code. - Fix issues such as out-of-bounds memory access or incorrect data manipulation based on the information provided by GDB.
- Launch the program with GDB by using the command
- Compiler Optimization:
- Compile your code with optimization flags (
-O2,-O3) to allow the compiler to optimize the executable. - Look for unnecessary copies or inefficient loops in your code that can be optimized.
- Pass by const reference instead of by copy for functions that are called frequently to improve performance.
- Compile your code with optimization flags (
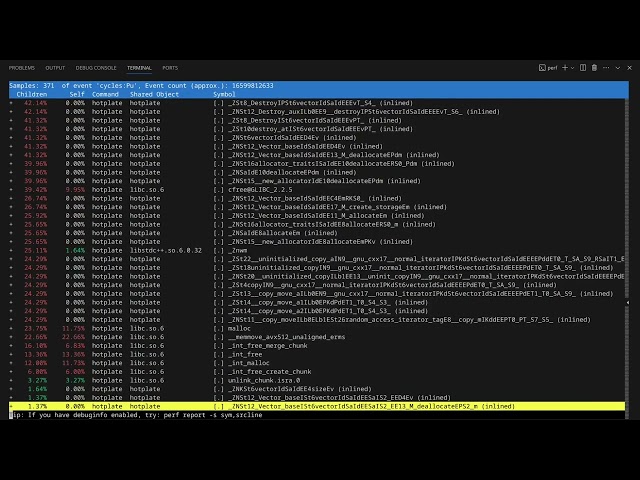
- Profiling with Perf:
- Record a run of your program using Perf by running
perf record <executable_name>. - Analyze the Perf report to identify areas of slowness, such as high cache miss rates or excessive system time.
- Optimize memory access patterns or eliminate unnecessary operations to speed up the program.
- Record a run of your program using Perf by running
- Memory Optimization:
- Ensure efficient memory usage by restructuring data access patterns.
- Consider using large single vectors instead of vectors of row vectors to decrease cache miss rates.
- Reduce memory footprint by pre-allocating and swapping buffer rows instead of copying data at each step.
- Assembly-Level Optimization:
- Check the compiled code using Perf to see the assembly instructions generated by the compiler.
- Optimize for modern hardware by instructing the compiler to use specific vector instructions like AVX2.
- Hand-tune assembly code if necessary to further improve performance.
By following these steps and applying the techniques discussed in the video, you can effectively debug and optimize your C++ code to achieve significant performance improvements. Don't hesitate to experiment with your own code and explore different optimization strategies to see what works best for your specific application. Happy coding!
Test your Knowledge
What is the purpose of debugging in C++?
What is the purpose of debugging in C++?
Advanced Insights into C++ Code Debugging and Optimization
In this section, we will delve into advanced aspects and deeper insights into debugging and optimizing C++ code using tools like GDB, Valgrind, and perf. Let's explore some key tips, recommendations, and expert advice to enhance your understanding of this topic.
-
Compiler Optimizations: Compiler optimizations can significantly impact the speed of your program without much effort on your part. Allowing the compiler to optimize code can lead to dramatic speedups in execution time.
-
Memory Optimization: Pay attention to memory usage patterns in your code. Unnecessary copies and inefficient memory access can slow down your program. Pass variables by const reference instead of making unnecessary copies to improve performance.
-
Algorithmic Optimizations: Consider restructuring your algorithms for better performance. Simplifying loops, discarding redundant operations, and optimizing mathematical calculations can lead to substantial speed improvements.
-
Cache Miss Rate Reduction: High cache miss rates can hinder program performance. Analyzing cache miss rates with tools like Valgrind can help identify memory access inefficiencies. Reordering loops and data structures can optimize memory access patterns and reduce cache misses.
-
Assembly Code Optimization: For utmost performance, consider hand-tuning assembly code or at least checking the assembly generated by the compiler. Utilizing vector instructions (such as AVX2) for parallel processing can further boost performance.
Curiosity Question: How can you leverage tools like Valgrind, GDB, and perf in combination with advanced C++ knowledge to optimize complex algorithms and achieve near-optimal performance?
By incorporating these advanced insights and strategies into your C++ debugging and optimization workflow, you can elevate your programming skills and enhance the efficiency of your code. Explore further, experiment, and strive for continuous improvement in your software development journey.
Additional Resources for C++ Debugging and Optimization
-
Valgrind User Manual - A comprehensive guide on using Valgrind for memory debugging and profiling.
-
GDB Tutorial - A tutorial on using GDB for debugging C++ code effectively.
-
Perf Command Usage Examples - Explore different ways to use
perfcommand for performance analysis and optimization. -
C++ Performance Tips - Tips and tricks for managing memory efficiently in C++ to optimize performance.
-
Modern C++ Optimization Techniques - Learn about modern optimization techniques and tools available for C++ development.
Dive deeper into the world of C++ debugging and optimization with these valuable resources. Enhance your skills and understanding to improve the performance of your C++ code. Happy coding!
Practice
Task: Test and debug the C++ project you have been working on. Use debugging tools (e.g., gdb) to fix any issues, and identify areas where performance improvements can be made (e.g., reducing memory usage, optimizing loops).
HNG PREMIUM NETWORK —
Join HNG Premium Network!
Gain access to internships, job opportunities, and certifications. Enjoy free courses, networking events, tech collaborations, interview prep training, and CV reviews. Connect with mentors, past interns, and fellow tech enthusiasts while working on real-world projects.
Join the Network for ₦7 000