Profiling Queries
SQL Server Profiler is a powerful tool used to create and manage traces, analyze trace results, and replay specific series of steps to diagnose database engine or analysis Services issues.
Lets Go!
Profiling Queries
Lesson 49
Learn how to analyze and profile SQL queries to identify performance bottlenecks.
Get Started 🍁Introduction to SQL Server Profiler
Welcome to our course on SQL Server Profiler! In this course, you will delve into the powerful tool of SQL Server Profiler, which serves as a rich interface for creating, managing, analyzing, and replaying traces in SQL Server.
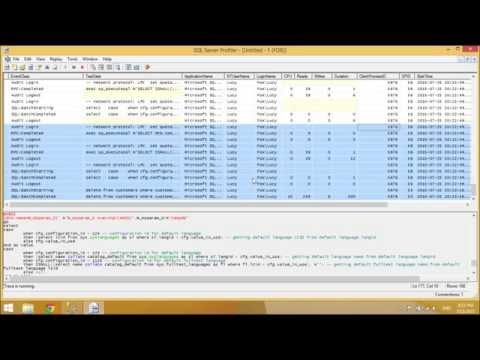
SQL Server Profiler provides a graphical user interface for monitoring database engines or analysis services. By using this tool, you can closely observe SQL commands, filter event data, and diagnose problems efficiently.
Have you ever wondered how to effectively trace and analyze SQL commands in SQL Server? Join us in this course to unlock the secrets of SQL Server Profiler and enhance your database management skills. Let's embark on this exciting journey together!
Main Concepts of SQL Server Profiler:
-
SQL Server Profiler Interface:
- SQL Server Profiler is a tool that allows users to create and manage traces, as well as analyze and replay trace results.
-
Trace File:
- Events captured by the SQL Server Profiler are saved in a trace file. This file can be later analyzed or used to replay a specific series of steps for troubleshooting purposes.
-
Functionality:
- Microsoft SQL Server Profiler provides a graphical user interface for monitoring database engine instances or analysis Services. Users can view SQL commands, filter data by client process, and pause filtering when needed.
-
Data Filtering:
- While creating a trace or template, users can define criteria to filter the data collected by the event. This helps prevent traces from becoming overloaded with data. Filtering allows only a subset of the event data to be collected, making analysis more focused and manageable.
-
Event Output:
- If a filter is not set, all events of the selected event classes are returned in the Trace output. Filtering by specific criteria allows for more targeted and relevant event data to be captured during monitoring.
By understanding these main concepts of SQL Server Profiler, users can effectively utilize this tool for monitoring database activities, analyzing performance, and diagnosing problems within the SQL Server environment.
Practical Applications of Using SQL Server Profiler
SQL Server Profiler is a valuable tool for monitoring and diagnosing issues in your SQL Server database. Here is a step-by-step guide to using SQL Server Profiler for beginners:
-
Opening SQL Server Profiler:
- Launch SQL Server Profiler from the Start menu or from within SQL Server Management Studio.
-
Creating a Trace:
- Click on "File" and then "New Trace" to create a new trace session.
- Select the events you want to capture by checking the boxes next to them.
- You can also filter events by client process ID to focus on specific activities.
-
Filtering Data:
- To filter data, click on the "Filter" button.
- Define criteria such as client process ID to narrow down the data being collected.
- Click "Apply" to save the filter settings.
-
Replaying Trace Results:
- Once you have captured a trace, you can save it as a trace file for later analysis.
- Use the "Replay" feature to replay the traced events and analyze the performance of the database.
-
Analyzing Results:
- After capturing and replaying a trace, you can analyze the results to identify any performance issues or bottlenecks.
-
Practice and Experiment:
- Try creating different types of traces with various filters to understand how SQL Server Profiler can help in monitoring and diagnosing database issues.
Start by opening SQL Server Profiler and creating a simple trace session. Experiment with different events and filters to see how they impact the data being collected. Happy tracing!
Test your Knowledge
What does SQL profiling help with?
Advanced Insights into SQL Server Profiler
In addition to the basic features of SQL Server Profiler mentioned in the video, there are several advanced aspects and insights that can enhance your proficiency in using this tool.
Advanced Filtering Techniques
-
Client Process Filtering: One advanced filtering technique is to filter the events by client process ID. This can help you focus on specific connections or applications interacting with the database, allowing for more targeted analysis.
-
Event Data Subset Filtering: To prevent traces from becoming overwhelming with data, you can filter them to collect only a subset of the event data. This refined approach can make it easier to pinpoint the root cause of performance issues or errors.
Expert Tip
- Pausing Before Filtering: It is recommended to click on the pause button before applying any filtering criteria. This ensures that the trace remains synchronized and accurate while filtering the data.
Curiosity Question
- How can advanced filtering in SQL Server Profiler help in optimizing database performance? Explore different scenarios where fine-tuning event data collection can lead to more efficient troubleshooting and analysis.
Additional Resources for SQL Server Profiler
- Microsoft SQL Server Profiler Documentation
- SQL Server Profiler Tutorial
- Introduction to SQL Server Profiler
- SQL Server Profiler Best Practices
Expand your knowledge of SQL Server Profiler by exploring these informative resources. Dive deeper into the tool's functionality, learn best practices, and enhance your understanding of monitoring and analyzing SQL Server instances. Happy learning!
Practice
Task: Enable query profiling.
Task: Run complex queries and interpret their profiles.